ADEQ

Performance at a Glance

Revised On: Oct. 1st, 2026 - 04:31 pm

How we protect our environment, serve the regulated community, and manage our resources is completely interconnected. By tracking everything from permit pipelines to environmental compliance and funding sources, we hold ourselves accountable to the communities we protect. These metrics offer a transparent, high-level view of the health and scale of our operations, keeping our stakeholders, industry partners, and the public informed about our agency’s performance.

Permits & Facilities: 

Shows active individual and general permits and licenses issued by fiscal-year quarter and is updated monthly. To see the graph and map in greater detail, click the image or | Download PDF >
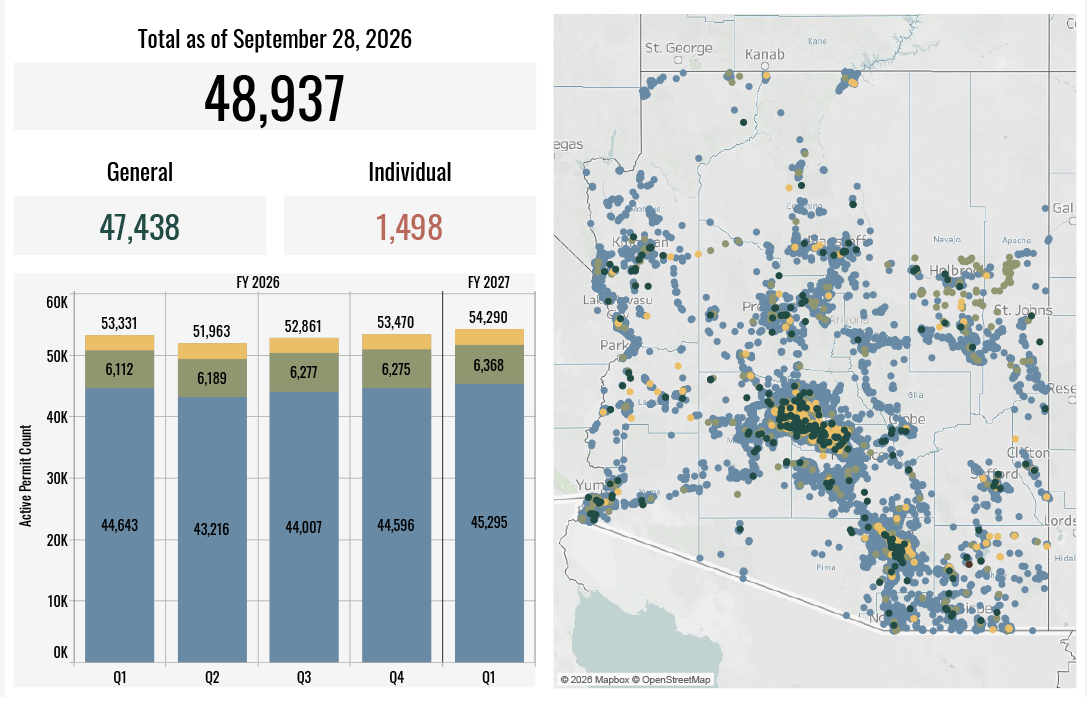
Image of a graph that shows the # of permits usedd year to date of 48,937 of which 1,498 are individual permits vs general permits

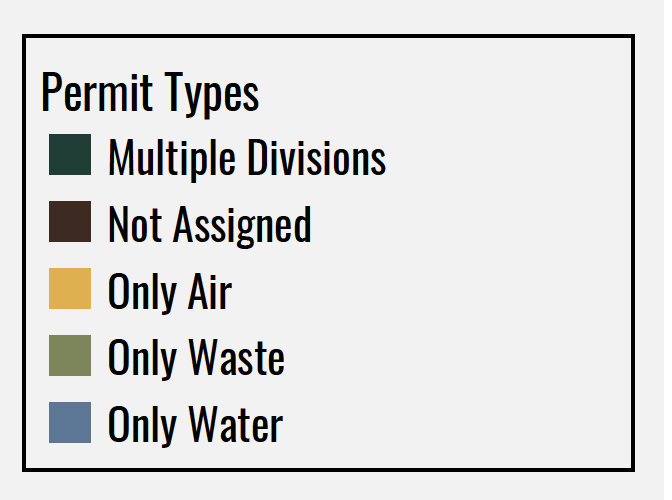
  Color Key:

Color key for the permits graph/map

Shows active regulated facilities by fiscal-year quarter and is updated monthly. To see the graph and map in greater detail, click the image or | Download PDF >
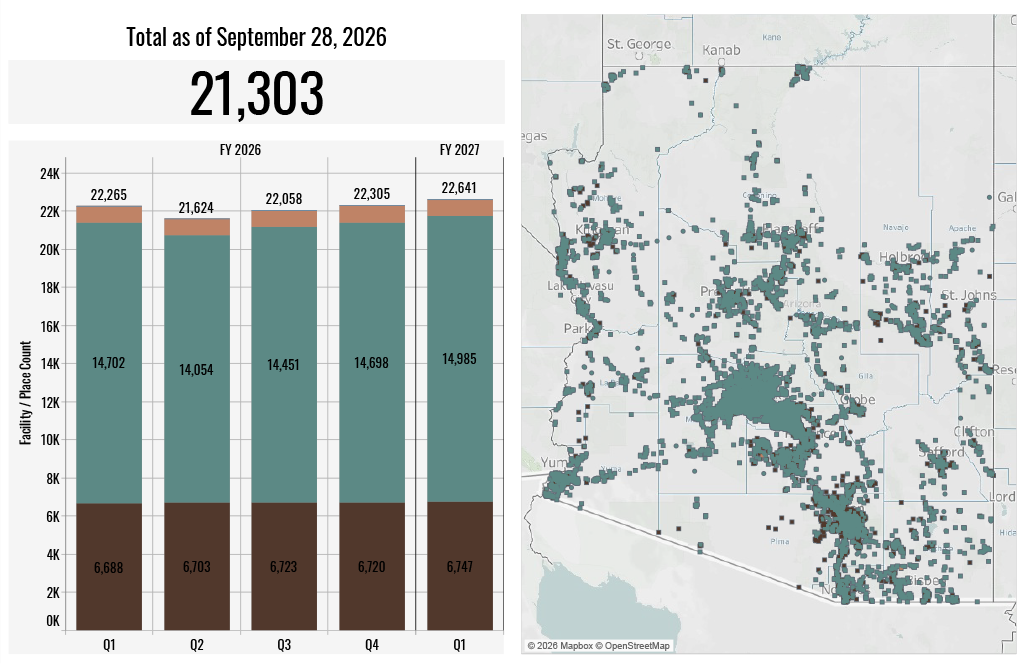
A graph and a map that shows 21,303 regulated facilities in AZ

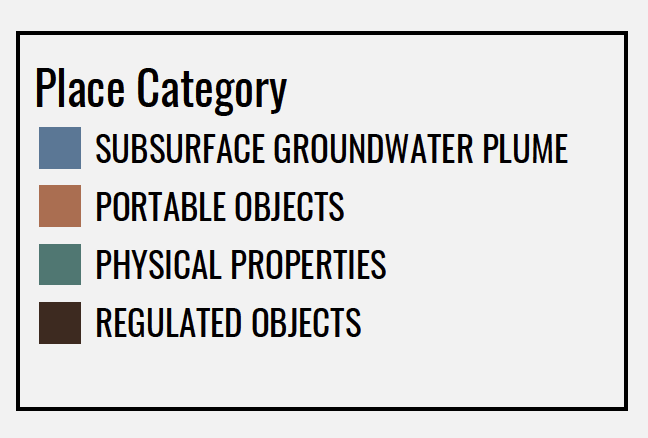
  Color Key:

Color key for facilities graph/map

Shows active individual permits and licenses in process by fiscal-year quarter and is updated monthly. To see the graph and map in greater detail, click the image or | Download PDF > | View this Month's PIP Report > 
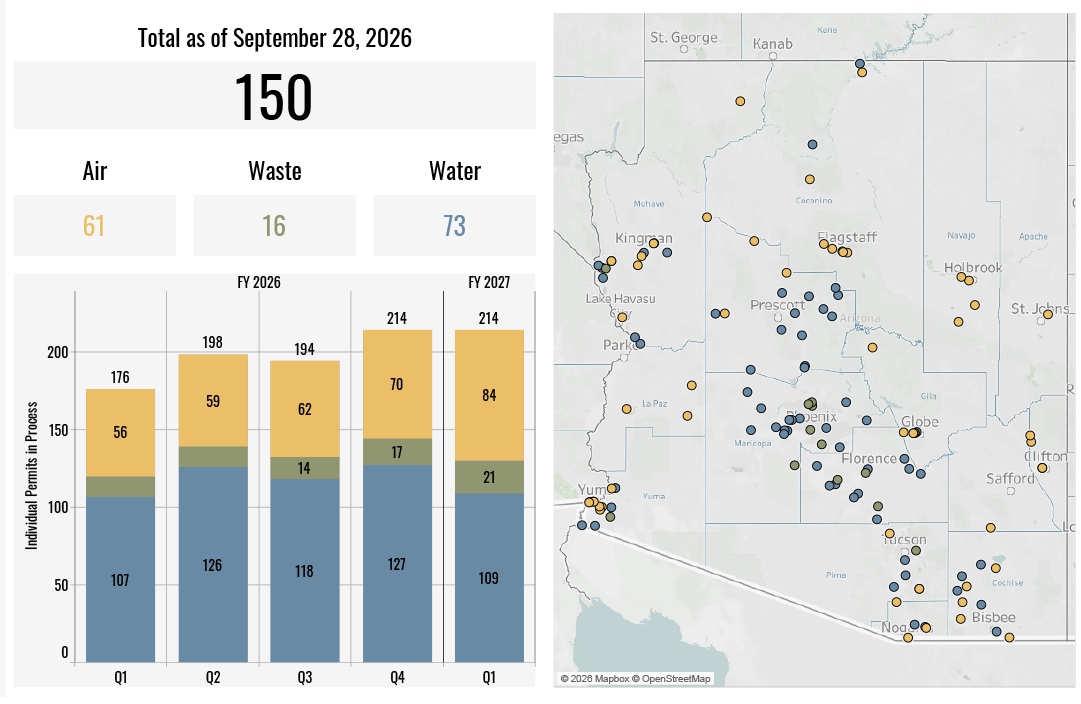
Graph and a map that shows 150 active permits being reviewed/issued by ADEQ

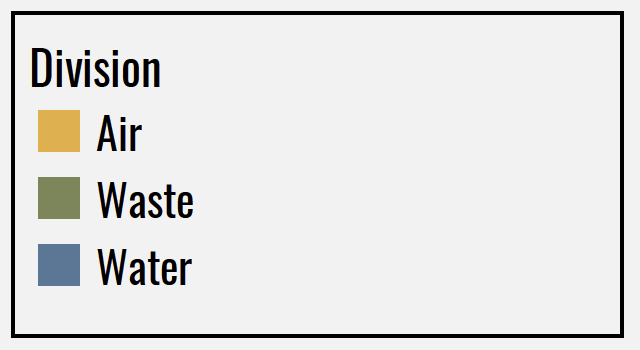
  Color Key:

color key for pip graph and map

Funding:

Shows ADEQ's fiscal-year funding by source and is updated annually. To see the graph and map in greater detail | Download PDF >
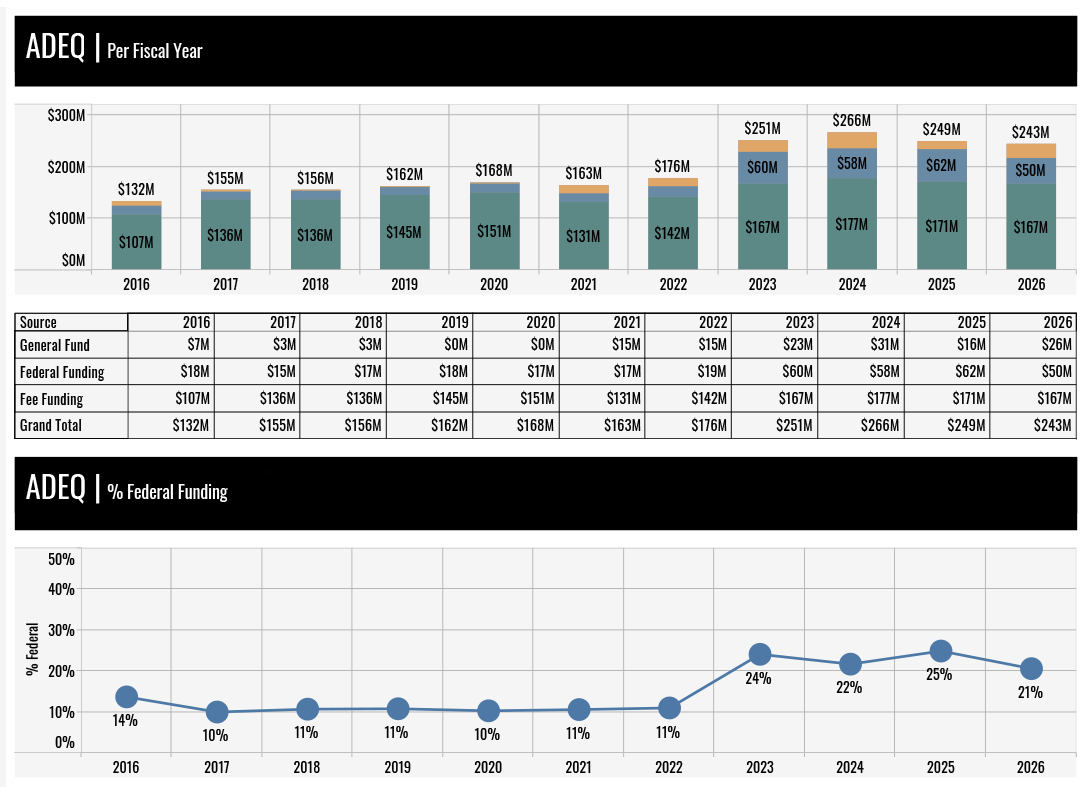
graph of ADEQ Budget by fund source for current FU

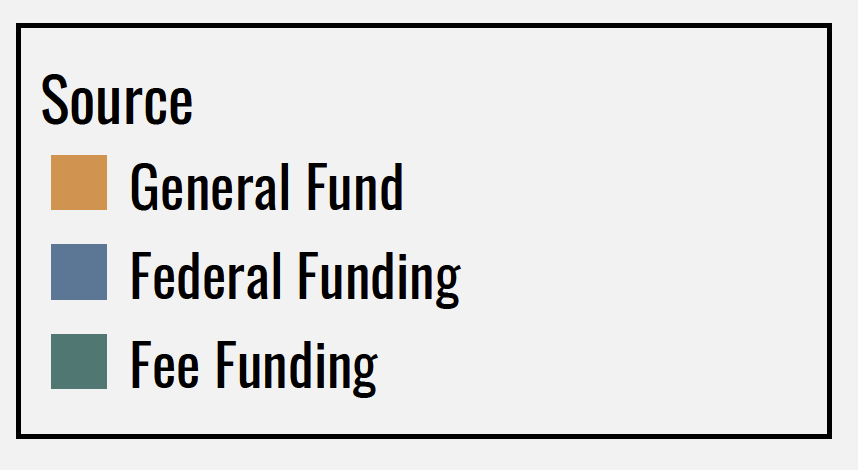
  Color Key:

Color Key for Funds Graph/Map

Other Metrics:

Shows airsheds in non-attainment status by fiscal year and is updated monthly.

A non-attainment area is a distinct geographic area where criteria pollutants are above the acceptable levels defined by the National Ambient Air Quality Standards (NAAQS) set by the U.S. Environmental Protection Agency (EPA) under the Clean Air Act | Learn More >. To see the graph and map in greater detail | Download PDF >
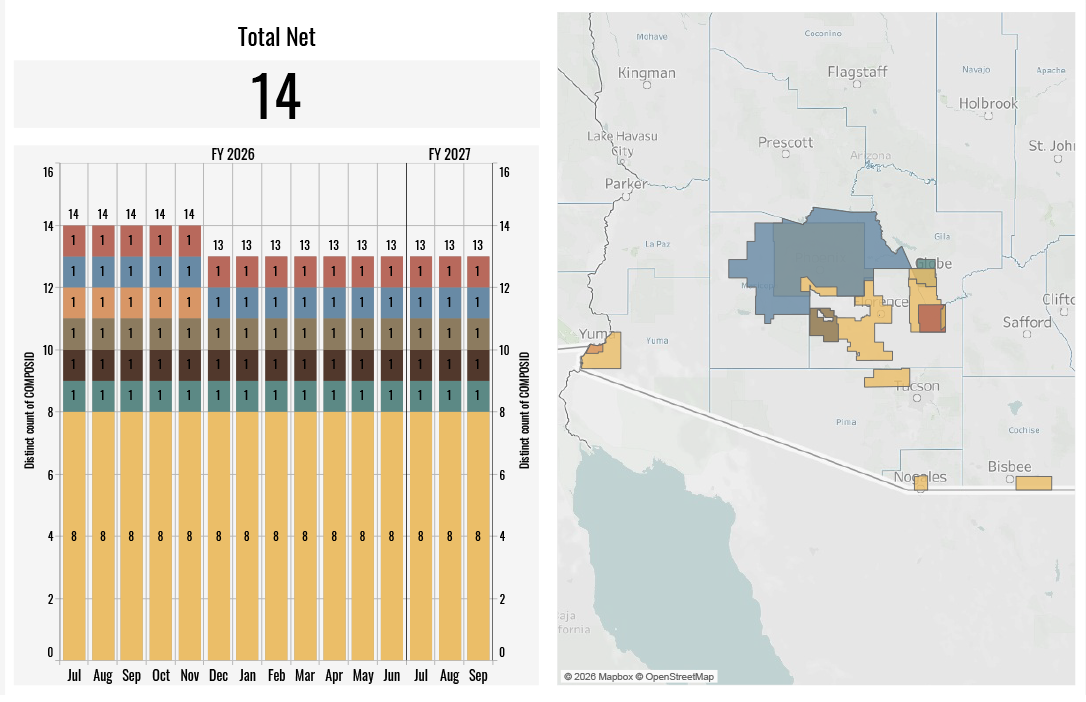
graph and a map that shows AZ 14 non-attainment areas

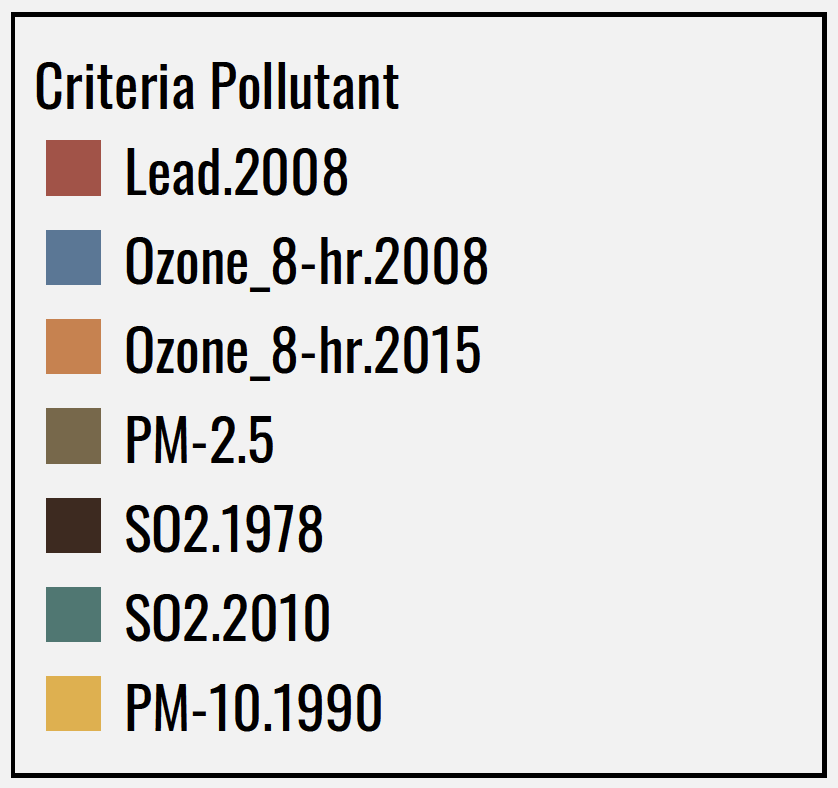
  Color Key:

a color key for the graph/map above explaining what pollutant is what

__________________________________________________________________________________
 
Check back each month for updated metrics and progress reports.